


Entering the Market: 3. Strength
Importance of Buying and Sell Pressure


The first and second questions identify the Condition and Context of any market. The third question that a Professional asks before entering a trade is:
How well is the market doing what it intends?
Answer to this questions explains the Strength of the Market. A Professional risks capital after they know the Buying or Selling Pressure.
The market moves in search of value when either bull's buying or the bear's selling is stronger. The excess buying or selling pressure is the strength needed to drive the market higher or lower.
A Simple (Detailed) Explanation of Strength
(Advanced: You may want to skip this section if your interest is only in the tool).
Every market is climbing up or down the rungs of a market ladder. The ladder is the Limit Order Book in any market. The example of this is the DOM (depth of market) display a trader sees on their screen. And look like this.
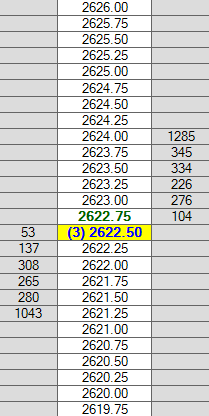
Every price point (tick) of an instrument or market is a rung on the ladder. The Bids (buyers) are on the left and the Asks (sellers) are on the right. These are standing limit orders at a specific price and remain until executed or closed.
If a trader places a market order to buy 100 shares, they execute at the current market price of 2622.75. The Limit Orders at the price would drop to only 4 remaining orders. And the market price would remain the same.
The next market order to buy 100 shares executes at 2622.75 for 4 shares and 2623.00 for 96 shares. The current price would adjust up to 2623.00. The standing limit orders at that price would now be 180 shares. The buying pressure was greater than the supply of sellers and pushed the market higher.
When a large number of buy orders or a single large order come in, it can sweep through several rungs of the ladder. This is buying pressure. The market price will advance much higher. (This is a simple explanation and the DOM shows much more than this alone. Level 3 quotes can show the stacking and pulling of orders and more. Professionals use this information to time their entries. This is all explained in the TLAP course.)
The takeaway is the Limit Order Book is a valuable resource for seeing the strength of the market in real time.
A Tool for Measuring Buying and Selling Pressure
The tool to use is the 20-Bar Lookback with a chart for the time frame you trade (Weekly, Daily, 5-min, etc.).
Counting back 20-bars: we have 10 bullish, 6 bearish and four neutral
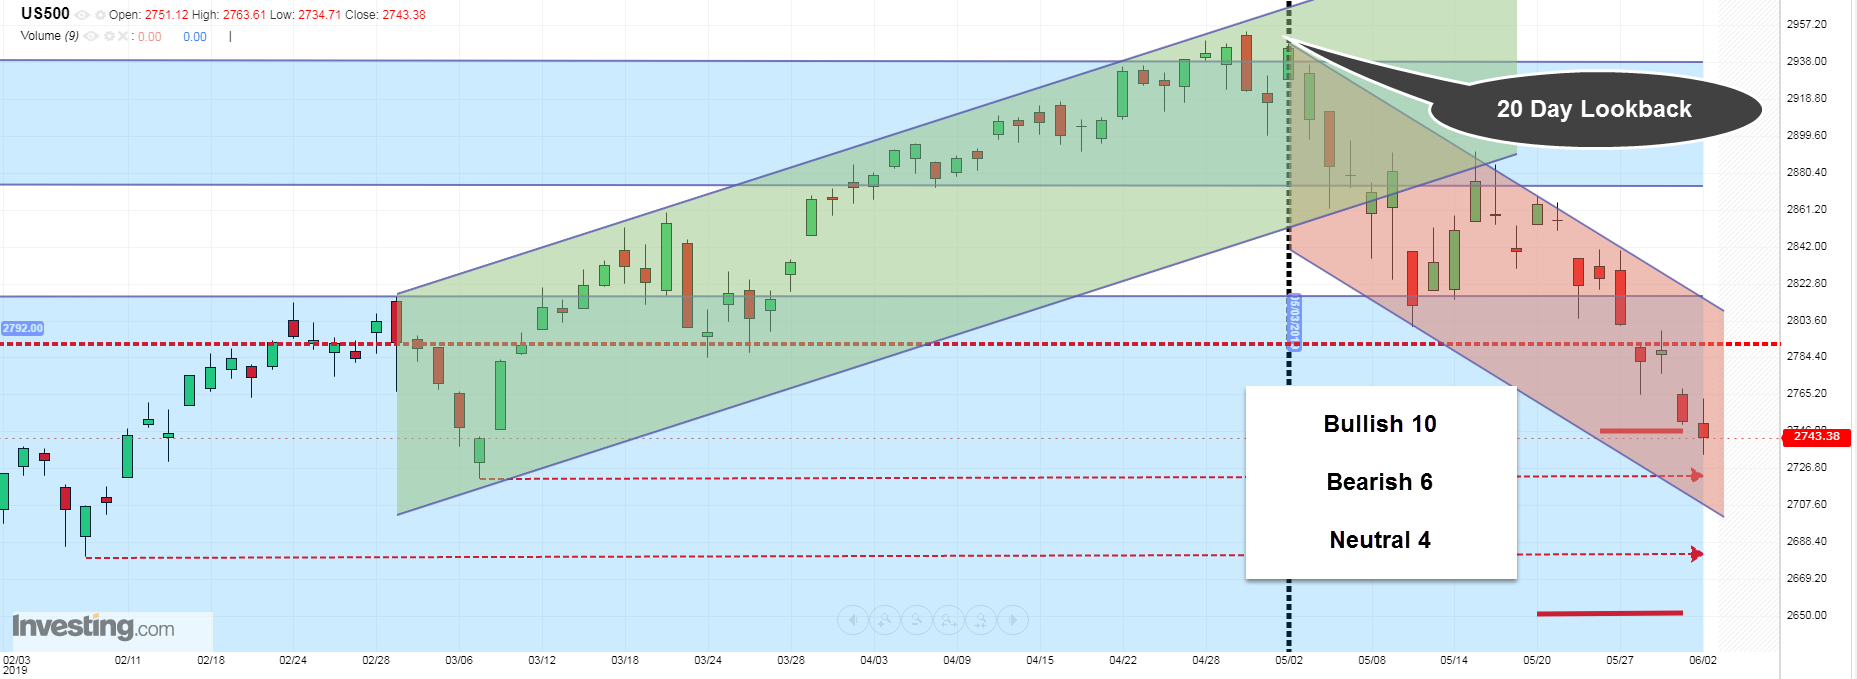
What followed, was a significant rally.
How to apply:
Count 20-bars back in your preferred time frame.
Answer Four Questions:
What is the colour of the bars?
What is the size of the bars?
Are there more Wicks or more Tails?
What is the number of Bullish and Bearish bars?
What is the colour of the bars?
The green or red coloring on most charts shows only the price movement from open to close. It does not accurately display the Strength of the market. Below, both bars on the left are bearish, the largest push was downward, by the Bears. Both bars on the right are bullish, because the largest push was upward by the Bulls.

Professional charts would color the 2nd bar on the left a lighter color of red. And the 1st bar on the right a lighter version of green. Making it easier to count 20-bars back. (Note: Professional charting programs will even keep a running count for the trader.)
Whether the body of the bar is above or below the mid of the daily range determines Strength. The buying and selling pressure should color the bar. You can now determine whether the bulls or bears controlled the bar. This is true for all time frames.

What is the size of the bars?
The bigger the body of the bar the greater the push in one direction. Thus more strength.
Are there more Wicks or more Tails?
Wicks are a push above the body of the bar and tails are a push below the body. Wicks form when the bear reverse a push by the bulls (i.e. bearish). Tails form when the bull reverse a push by the bears (I.e. bullish).
A larger number of one over the other adds to the directional strength of the market.
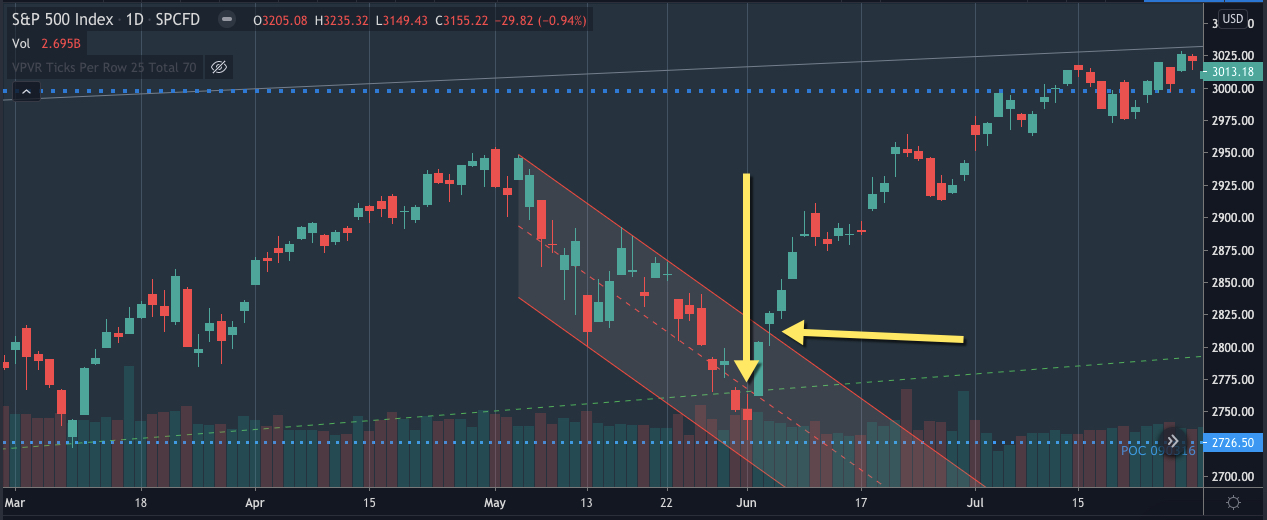
You will often see a collection of tails form on bars at a low before a large rally. The opposite is not the case with wicks at highs, for reasons we will discuss at a later date.
What is the number of Bullish and Bearish bars?
By counting the number of bullish and bearish bars in a 20-bar lookback you can identify Strength. Remember bullish not green and bearish not red. Tracking this over time you can see the strength in the market shift from bullish to bearish and back again.
The buying and selling pressure adds Strength to the Condition and Context of the market.
Next post: we will discuss Probability and the creation of Hypotheticals. This allows Professionals to know What’s most likely to happen next, and when to enter the market.
If you want to learn about this and more I have two resources for you:
- Online Self-Paced Course: Trade Like A Pro (TLAP) course. Learn to trade like a Professional at your own pace. Read the testimonials here.
- Group Mentoring: Join the Mastermind Group and get the TLAP course for free.
Be well and trade like a pro,
Lloyd
P.S. if you found this of value please like and subscribe, thanks.
If you are already subscribed, please share with others.